Difference between revisions of "File:House production.png"
From GRFSpecs
Jump to navigationJump to search (House production vs. population / mail generation. Made with gnuplot: set border 0 set size square set xzeroaxis lt -1 set yzeroaxis lt -1 set arrow from graph 1,0 to graph 1.05,0 size screen 0.025,15,60 filled set arrow from graph 0,1 to graph 0,1.0...) |
(No difference)
|
Revision as of 11:08, 31 August 2014
House production vs. population / mail generation.
Made with gnuplot:
set border 0 set size square set xzeroaxis lt -1 set yzeroaxis lt -1 set arrow from graph 1,0 to graph 1.05,0 size screen 0.025,15,60 filled set arrow from graph 0,1 to graph 0,1.05 size screen 0.025,15,60 filled set tics scale 0 set format x "" set format y "" set xlabel "population / mail gen." set ylabel "production"
set term pngcairo size 190,190 set output "house_production.png"
plot [0:1] [0:1] \
(x**2) with lines notitle
File history
Click on a date/time to view the file as it appeared at that time.
| Date/Time | Thumbnail | Dimensions | User | Comment | |
|---|---|---|---|---|---|
| current | 11:08, 31 August 2014 | 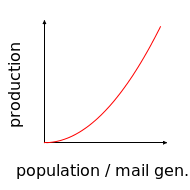 | 190 × 190 (6 KB) | Adf88 (talk | contribs) | House production vs. population / mail generation. Made with gnuplot: set border 0 set size square set xzeroaxis lt -1 set yzeroaxis lt -1 set arrow from graph 1,0 to graph 1.05,0 size screen 0.025,15,60 filled set arrow from graph 0,1 to graph 0,1.0... |
You cannot overwrite this file.
File usage
The following page links to this file: